MariaDB ships with conservative defaults designed to work on any hardware. On a dedicated VPS where you know how much RAM is available, a few targeted changes make a real difference.
The Most Important Setting — InnoDB Buffer Pool
The InnoDB buffer pool is RAM that MariaDB uses to cache frequently accessed data and indexes. When data is in the buffer pool, queries are served from memory. When it’s not, MariaDB reads from disk — which is orders of magnitude slower.
The default innodb_buffer_pool_size is 128MB. On a VPS with 2–4GB RAM dedicated to a WordPress site, this is too small.
Recommended values:
| VPS RAM | innodb_buffer_pool_size |
|---|---|
| 1GB | 256MB |
| 2GB | 512MB |
| 4GB | 1GB |
| 8GB | 2–4GB |
Step 1 — Create a Custom MariaDB Config
Don’t edit /etc/my.cnf directly — create an override file:
sudo nano /etc/my.cnf.d/wordpress-tuning.cnfAdd:
[mysqld]
# InnoDB buffer pool — adjust based on your VPS RAM
# For 2GB VPS:
innodb_buffer_pool_size = 512M

# InnoDB log file size — larger = fewer writes
innodb_log_file_size = 128M

# Connections
max_connections = 50
max_connect_errors = 10000

# Slow query logging — finds actual bottlenecks
slow_query_log = 1
slow_query_log_file = /var/log/mysql/slow-queries.log
long_query_time = 2

# Temp tables
tmp_table_size = 32M
max_heap_table_size = 32M
Create the log directory:
sudo mkdir -p /var/log/mysql
sudo chown mysql:mysql /var/log/mysql
Restart MariaDB:
sudo systemctl restart mariadbStep 2 — Verify Settings Applied
mysql -u root -p -e "SHOW VARIABLES LIKE 'innodb_buffer_pool_size';"
mysql -u root -p -e "SHOW VARIABLES LIKE 'slow_query_log';"
Both should reflect the values you set.
Step 3 — Read the Slow Query Log
After the site has been running for a while under real traffic:
sudo tail -50 /var/log/mysql/slow-queries.logEntries look like:
# Query_time: 3.456789  Lock_time: 0.000123  Rows_sent: 1  Rows_examined: 50000
SELECT * FROM wp_options WHERE autoload = 'yes';
Query_time is how long the query took. Rows_examined vs Rows_sent ratio shows index efficiency — examining 50,000 rows to return 1 means no useful index is being used.
For WordPress specifically, the most common slow queries are:
wp_optionsautoload queries — addressed by Rediswp_postmetajoins without proper indexes — plugin-generatedwp_postsfull-text searches — use a search plugin or Typesense
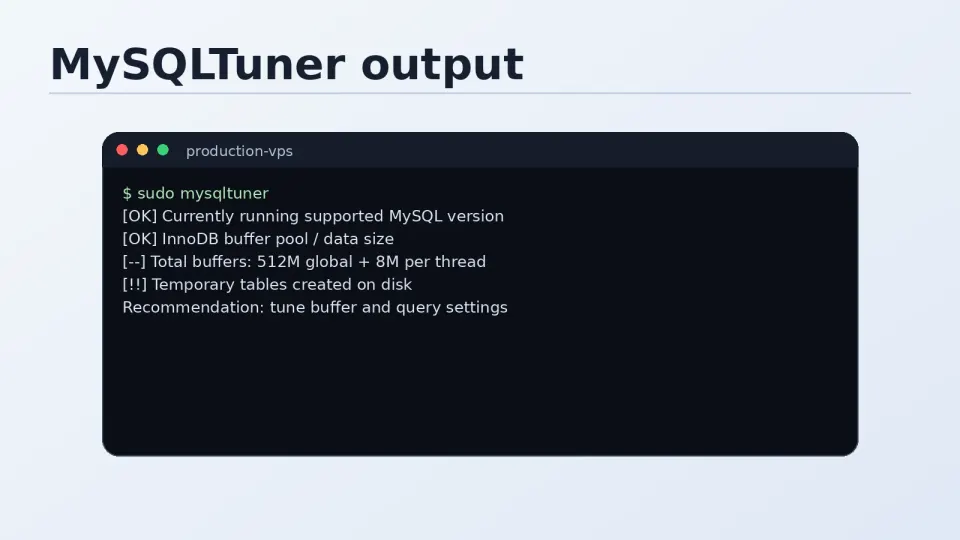
Step 4 — Run mysqltuner After 24 Hours
mysqltuner analyzes your MariaDB usage patterns and recommends specific settings:
sudo dnf install mysqltuner -y
sudo mysqltuner --user root --pass yourpassword
Run it after the server has been live for at least 24 hours — it needs real usage data to make useful recommendations. The output includes specific variable suggestions based on your actual workload.
Part 6 Complete — Performance Summary
With all Part 6 optimizations in place on top of the Part 4 stack:
| Layer | What it does |
|---|---|
| Nginx FastCGI cache | Serves cached pages without PHP |
| Redis object cache | Eliminates repeat database queries |
| PHP-FPM tuning | Right number of workers for your RAM |
| MariaDB InnoDB tuning | More data cached in memory |
For a typical WordPress content or affiliate site, this stack handles traffic well within a 2–4GB VPS budget. The bottlenecks that remain are application-level — plugin efficiency, query optimization, image sizes — not server configuration.